Visualize your costs

Oracle users do trust this big company. Nowadays it is all about Data Driven Business. Taking control over your consumption and costs is expected, no matter how big the consumer is. Cloud services underline this fact even more. Oracle does have a precise billing with online access, but it is all about raw data and consumption history of "only" 180 days. Having mechanism to aggregate and visualize data (trends and peaks) and notify users when limit is reached is something this solution offers enabling both reactive and predictive options to take place. Both Oracle and its clients can establish even tighter bonds and relationship by having this service. Saga delivers Oracular – a simple web-based service to aggregate and visualize company’s consumption costs towards Oracle cloud services for existing users.


Visualize your costs

Oracle users do trust this big company. Nowadays it is all about Data Driven Business. Taking control over your consumption and costs is expected, no matter how big the consumer is. Cloud services underline this fact even more. Oracle does have a precise billing with online access, but it is all about raw data and consumption history of "only" 180 days. Having mechanism to aggregate and visualize data (trends and peaks) and notify users when limit is reached is something this solution offers enabling both reactive and predictive options to take place. Both Oracle and its clients can establish even tighter bonds and relationship by having this service. Saga delivers Oracular – a simple web-based service to aggregate and visualize company’s consumption costs towards Oracle cloud services for existing users..


BENEFITS

Great options built-in by default in Oracular service:

Monitor and Visualize Company’s Costs and Consumption – representing data company produces by using Oracle cloud services

Consumption and Costs History – aggregated and reusable data

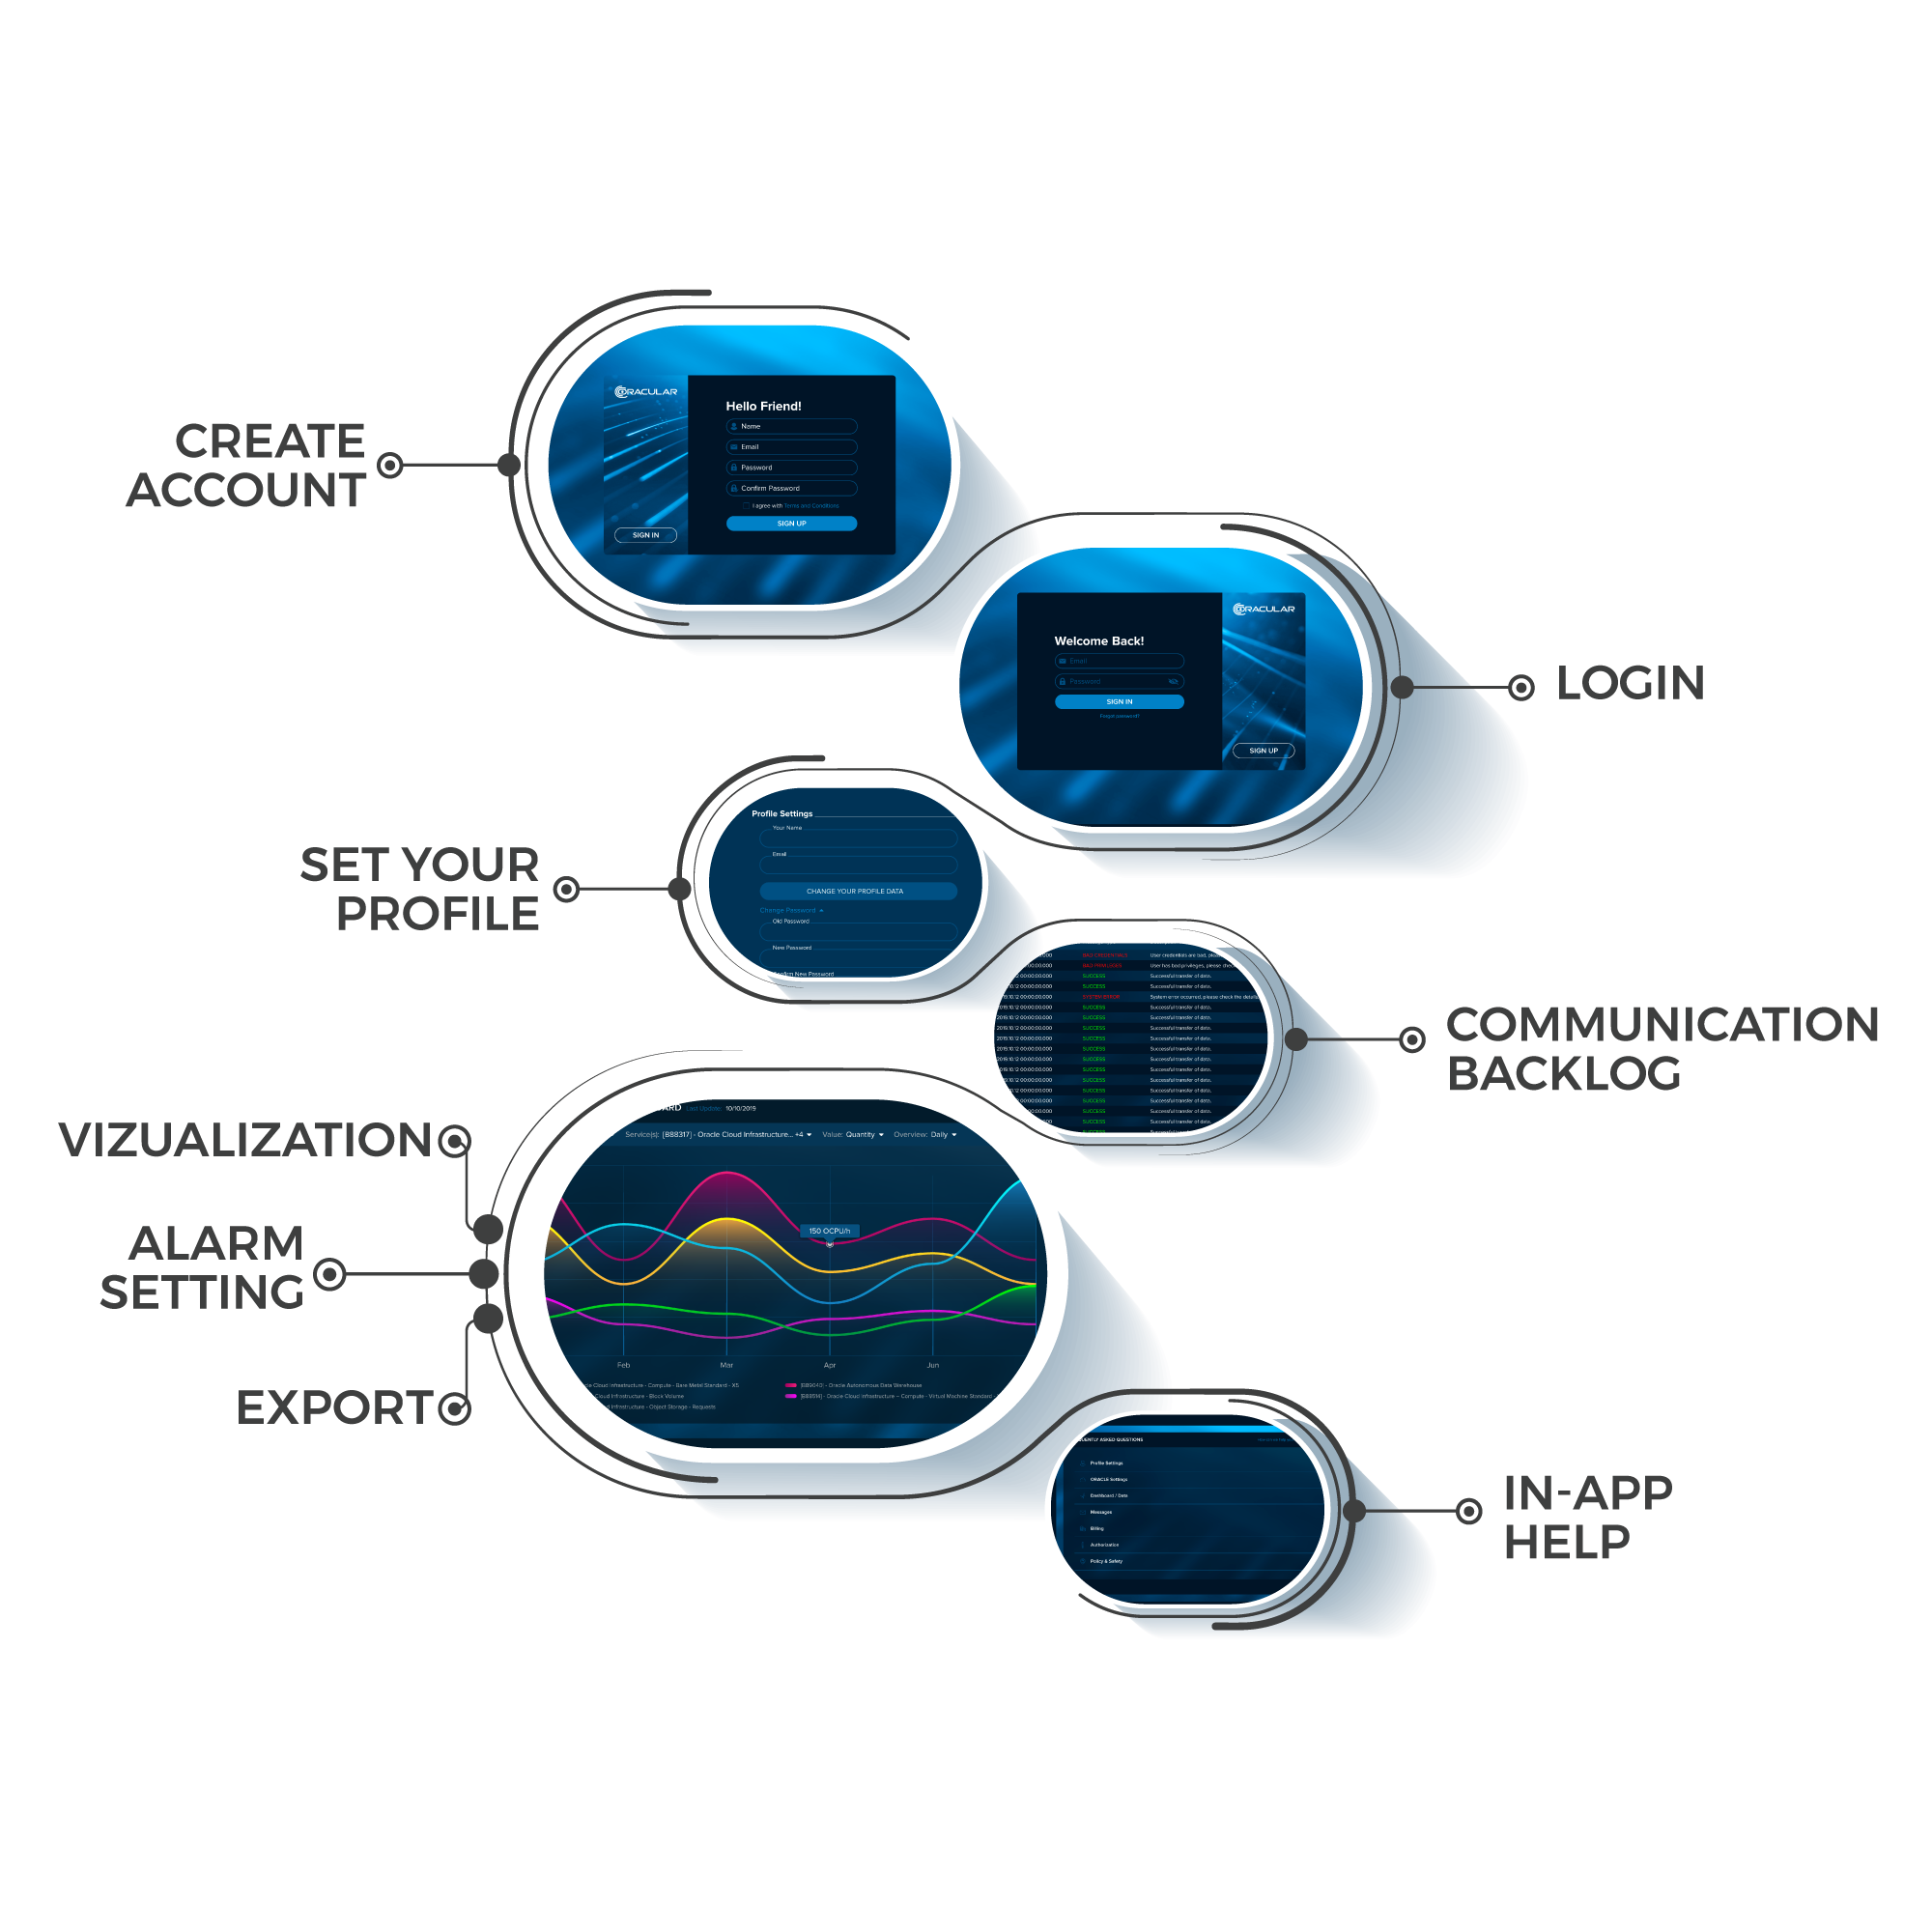
Simple to Use – subscribe, set, use

Patterns and Trends Search - based on Interactive Graphing and Reports

Peaks and Limits Customization - to be notified on time

Notification Mechanism – by having mail, sms or push message, on daily basis

Export Reports – any time, any where in various formats to be shared and analized

Web-based and Cross-device Compatible Application – secure and fast, applicable on all OS systems


Oracular – Architecture

Oracle cloud user registers on Oracular Site

Leaves credentials (Oracle cloud username and password with rights to Read – make calls to Oracle REST API)

Dedicated Oracular service checks if credentials are correct; Once verified are being used for making „consumption history“ for this particular user (additionally 180 days of previous period are stored as well)

Dedicated service, once a day (before midnight) makes an Oracle REST API call for gathering consumption for this particular Oracle cloud user/client

Fetched data are stored in local Oracle database

Based on that, user are enabled to see services usage and costs (consumtion history) in different ways. Basically, desired period of time is being choosen and on or more of current payed services (products) can be seleceted (multi-selection). Type of visualization (graph) is to be selected as well (set by default to one)

User query determines what data are retrieved from cloud Oracle database

Those data are being visualized throughout different graph options

All graphs are interactive, which includes alarm creation/setting.

Displayed data can be exported (.xlsx, pdf., plain text etc.)

The Whole Case

The Whole Case

Subscribe

Read credentials provided
Background service starts recorcording
Consumption History

Set

Set limits/peaks (per service, per time frame or value) and types of notifications (email, push or SMS)

Use

Log In and explore Interactive Graphs
Export findings and reports
Be notified

IN PRACTICE

oracular-arhitecture-za-sajt-2000x2000px